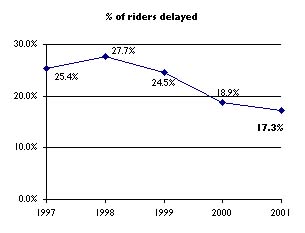
| On-time service improved systemwide as measured in our survey. As noted above,
Muni's overall rating improved to 17.3 percent of riders delayed (B-minus
grade), a small but significant improvement from 2000. Compared to Muni's nadir in
1998, however, this is more impressive: 28% of riders were delayed then, so
Muni has reduced delays by more than a third. Normalized waiting time got slightly
worse systemwide; customers waited an average of 76% of posted frequency (a 50% average
is optimal). |
 |
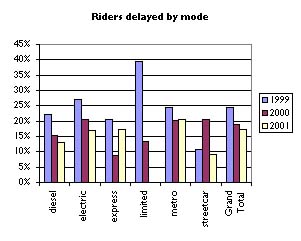
| On-time service was more consistent this year across the modes, with the F-Market
historic streetcar continuing to provide excellent service (graded A, 9% late) while
other modes showed improvement as well. Diesel and trolley coach lines both reduced
delays a small amount from 2000, with 13% and 17% riders delayed respectively
this year. (Both earned a B grade.) Muni Metro service did not get better, however:
as in 2000, 20% of riders were delayed. A chart of performance by mode is at right.
|  |
Service was also more consistent across various lines. For the first time
this year, no line was graded F and only one (the 38-Geary) was graded D,
with 32% of riders delayed. Of course, many lines were graded C, with delays in the
20-30 percent range, including many high-ridership lines (J, L, M, 22, 42, and more);
but the huge variations in quality we saw in 1997-99 are not present here. Muni deserves
significant credit for this progress - although no line should delay even 20% of
its customers, the appalling behavior of lines like the "L-Terrible" in
1998 (53% late!) seems to be no more.
8 of the 30 lines with sufficient data to report (20 points or more) were graded
A, including four diesel lines that use new equipment: 2-Clement, 108-Treasure Island,
43-Masonic, and 27-Bryant. Clearly fleet replacement is making a difference for on-time
service.
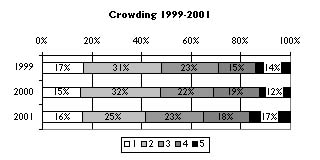
Crowding is an area where service is not improving. In 2001, more vehicles
were crush-loaded (17%, up from 12% last year) and many more were standing room only
(59%, up from 53% last year). Our crowding chart on page 19 shows this clearly. Some
of this is the result of increased ridership (a good thing!) but Muni needs to monitor
crowding closely and make sure that sufficient equipment is provided. The L-Taraval
and 108-Treasure Island both had average crowding over 4 on a 1-5 scale - clearly
too many of these trips were overcrowded. |
 |
| Finally, we measured cleanliness for the first time. Here Muni has some room
for improvement. 79% of Muni vehicles were clean systemwide, but several lines
had a problem staying clean; the 108 was the worst, with over half of its vehicles
dirty. JKLMN service from Castro to Market was also a problem here. The F was one
of the best again; this is in part due to the hard work done by the Market Street
Railway to keep the historic cars in shape. Maintenance crews of the other lines
should take note - and Muni staff should consider asking operators of lines where
cleaners are not available during the day to "pitch in" and collect the
garbage when customers don't do their part. Enforcing a zero-tolerance policy against
litter (as on BART) could help as well. |
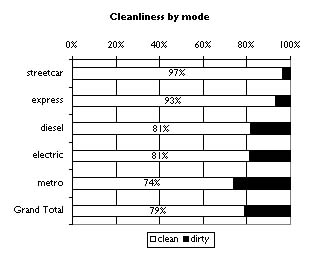 |
Table 2: Cleanest and dirtiest lines
| line |
% clean |
grade |
| Best: |
| 2 |
100% |
A |
| 6 |
100% |
A |
| 1 |
100% |
A |
| 42 |
100% |
A |
| F |
97% |
A |
| Worst: |
| JKLMN |
65% |
D |
| 33 |
62% |
D |
| K |
62% |
D |
| 15 |
60% |
D |
| 108 |
48% |
F |
| Total |
79% |
C |
This year, we noted another drop in participation in the survey. Our volunteers
were as dedicated as in previous years, but there were fewer of them; our 1773 data
points for a full month of service were the fewest for a systemwide survey since
the first survey in 1997. This unfortunately means that we do not have good data
for as many lines - the "B" grade given the 14-Mission, for example, is
only based on 13 data points, clearly not a sufficient sample. For Rescue Muni, of
course this is bad news; but it may be reflective of higher confidence in Muni, as
customers feel that they don't have to submit a survey is service is "okay."
We will study the comments submitted to try to understand this better before next
year's survey.
So is Muni getting better? Yes, it is. This survey shows real progress since last
year, and big improvements since Muni's worst days in 1998. But there is still more
to be done; in transit-first San Francisco, we should not declare victory until all
of Muni's customers get service that earns an "A" grade. Service expansion
will help here (see our detailed report in this newsletter), and continued fleet
replacement should also make a big difference, but the hard work by Muni employees
to plan and provide quality service will, as always, be the key to continued progress.
2001 Muni Riders' Survey:
Complete Results
route |
Total
resps |
%
late |
grade |
chg
01-00 |
avg
wait |
norm
wait |
avg
crowd |
% clean |
clean
grade |
2000 %late |
1999
%late |
1998
%late |
* |
| 2 |
28 |
0% |
A |
|
0:01 |
15% |
2.21 |
100% |
A |
|
19% |
9% |
|
| 108 |
21 |
0% |
A |
0% |
0:04 |
9% |
4.10 |
48% |
F |
0% |
|
0% |
|
| 43 |
49 |
3% |
A |
-8% |
0:10 |
89% |
1.75 |
88% |
B |
12% |
26% |
23% |
|
| 6 |
49 |
4% |
A |
-14% |
0:11 |
91% |
2.29 |
100% |
A |
18% |
21% |
21% |
|
| 27 |
22 |
5% |
A |
|
0:03 |
25% |
3.91 |
82% |
B |
|
2% |
|
|
| 44 |
53 |
8% |
A |
-2% |
0:12 |
83% |
2.71 |
92% |
A |
10% |
25% |
9% |
|
| F |
33 |
9% |
A |
-12% |
0:04 |
37% |
2.25 |
97% |
A |
21% |
11% |
13% |
|
| JKLMN |
52 |
10% |
A |
-5% |
0:01 |
46% |
2.40 |
65% |
D |
15% |
20% |
|
|
| 1 |
64 |
13% |
B |
-11% |
0:05 |
65% |
2.59 |
100% |
A |
24% |
28% |
23% |
|
| 33 |
43 |
14% |
B |
6% |
0:09 |
50% |
2.64 |
62% |
D |
8% |
12% |
|
|
| 9 |
21 |
14% |
B |
9% |
0:06 |
57% |
3.33 |
85% |
B |
5% |
31% |
27% |
|
| 24 |
79 |
14% |
B |
-2% |
0:06 |
62% |
2.72 |
80% |
B |
17% |
22% |
30% |
|
| 30 |
36 |
15% |
B |
-35% |
0:04 |
67% |
2.42 |
81% |
B |
50% |
26% |
21% |
|
| N |
348 |
16% |
B |
-5% |
0:07 |
81% |
3.11 |
74% |
C |
20% |
23% |
42% |
|
| 15 |
29 |
17% |
B |
|
0:08 |
92% |
2.36 |
60% |
D |
|
19% |
31% |
|
| 47 |
24 |
17% |
B |
2% |
0:02 |
56% |
3.17 |
84% |
B |
14% |
40% |
|
|
| K |
31 |
19% |
B |
16% |
0:08 |
69% |
2.31 |
62% |
D |
4% |
32% |
41% |
|
| 26 |
28 |
20% |
C |
|
0:17 |
94% |
2.25 |
92% |
A |
|
36% |
|
|
| 49 |
48 |
21% |
C |
-8% |
0:11 |
93% |
2.57 |
87% |
B |
29% |
23% |
29% |
|
| 30X |
24 |
21% |
C |
21% |
0:04 |
71% |
2.92 |
93% |
A |
0% |
|
20% |
|
| 5 |
39 |
26% |
C |
14% |
0:05 |
63% |
2.71 |
86% |
B |
12% |
16% |
28% |
|
| 22 |
34 |
26% |
C |
5% |
0:06 |
83% |
3.00 |
66% |
D |
21% |
22% |
29% |
|
| 42 |
27 |
27% |
C |
-3% |
0:08 |
124% |
2.94 |
100% |
A |
30% |
36% |
25% |
|
| KLM |
165 |
28% |
C |
10% |
0:05 |
100% |
3.38 |
69% |
D |
18% |
22% |
14% |
|
| L |
43 |
28% |
C |
-0% |
0:06 |
78% |
4.20 |
69% |
D |
28% |
26% |
53% |
|
| 21 |
43 |
29% |
C |
14% |
0:10 |
105% |
3.17 |
77% |
C |
14% |
26% |
30% |
|
| 67 |
24 |
29% |
C |
|
0:25 |
128% |
2.83 |
67% |
D |
|
|
|
|
| M |
24 |
29% |
C |
5% |
0:10 |
92% |
2.71 |
89% |
B |
25% |
26% |
31% |
|
| J |
61 |
30% |
C |
4% |
0:06 |
103% |
2.65 |
90% |
A |
25% |
36% |
42% |
|
| 38 |
37 |
32% |
D |
-19% |
0:07 |
107% |
3.03 |
79% |
C |
52% |
33% |
26% |
|
| |
|
|
|
|
|
|
|
|
|
|
|
|
|
| 18 |
13 |
0% |
A |
-11% |
0:07 |
43% |
2.77 |
75% |
C |
11% |
10% |
|
* |
| 45 |
17 |
2% |
A |
-33% |
0:05 |
46% |
1.63 |
63% |
D |
36% |
23% |
16% |
* |
| 16BX |
14 |
7% |
A |
1% |
0:04 |
37% |
3.57 |
100% |
A |
6% |
19% |
|
* |
| 71L |
11 |
9% |
A |
1% |
0:04 |
47% |
3.91 |
100% |
A |
8% |
|
|
* |
| 29 |
10 |
10% |
A |
-8% |
0:09 |
59% |
1.80 |
70% |
C |
18% |
40% |
|
* |
| 71 |
10 |
10% |
A |
-19% |
0:06 |
54% |
2.70 |
90% |
A |
29% |
23% |
31% |
* |
| 14 |
13 |
15% |
B |
-17% |
0:04 |
68% |
2.75 |
67% |
D |
32% |
47% |
51% |
* |
| 12 |
12 |
17% |
B |
|
0:04 |
49% |
1.60 |
100% |
A |
|
|
|
* |
| 23 |
12 |
17% |
B |
|
0:11 |
63% |
3.00 |
80% |
B |
|
13% |
|
* |
Total |
1773 |
17.3% |
B |
-2% |
0:07 |
76% |
2.94 |
79% |
C |
18.9% |
25% |
28% |
|
Notes:
1. Routes in italics with an asterisk (*) in the right column had fewer than 20 responses;
we are reporting them here for completeness, but these results should be considered
less accurate than those in roman type.
2. Crowding is on a scale of 1 (empty) to 5 (jammed).
3. Routes not linked to Transit Info
are either no longer in service (42, old 47) or not advertised in aggregate (KLM,
JKLMN). |