See also results graphs - graph1 graph2 graph3 graph4 graph5 graph6
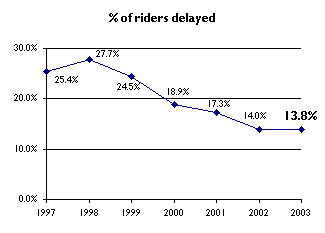
In March of 2003, Rescue Muni conducted its annual survey of Municipal Railway service reliability. This survey is done from the rider's perspective and attempts to show the chances that an individual rider will be delayed or on an overcrowded or dirty bus or streetcar. In 2003, Muni improved slightly over 2002, continuing a trend of improvement that began in 1999.
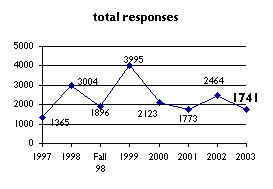
In 2003, volunteers submitted data for 1741 rides on Muni furing the month of March. (1499 were taken by volunteers riding the bus; the remaining were vehicles observed going by a fixed point by volunteers.) Volunteers also recorded direction, destination, time of arrival, crowding, and cleanliness.
Our volunteers found that riders were delayed 13.8% of the time, a slight improvement over last year's score of 14.0% delayed, and continuing to reflect a major improvement over the worst years of 1997-99.
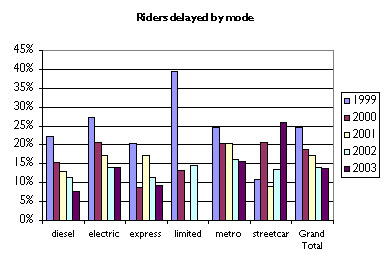
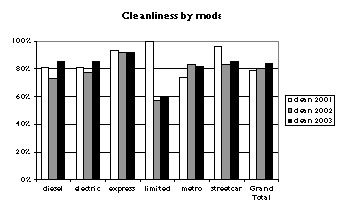
The charts on these pages also show Muni's performance on several other fronts. Service improved at least slightly on all modes except historic streetcar from 2002 to 2003. Cleanliness of Muni vehicles also improved slightly, with 84% reported clean, up from 82% in 2002.
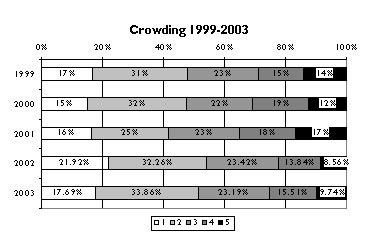
Not all metrics improved. Average crowding worsened very slightly from 2002, with an average crowding level of 2.7 on a scale of 1 to 5, up from 2.6 last year. More importantly, the number of vehicles reported overcrowded increased from 8.6% in 2002 to 9.7% in 2003 (see chart on page 7). This may be a result of ridership increases after severe declines after the dot-com bust.
The best lines in this year's survey were the 49-Mission/Van Ness and K-Ingleside, with no volunteers delayed (note that this was in the days that the K was run as a bus on the street, as streetcar service had not yet been restored). Other lines that did well included lines 4, 35, and 45.
Lines that performed poorly this year included the 1-California, graded "F" with 43% of riders delayed, and the 30-Stockton, graded "D" with 26% of riders delayed. Other lines that did poorly included the F-Market historic streetcar (substantially worse than in 2002), KLM service in the Market Street Subway, and the 7-Haight bus, all graded "C".
Most improved in 2003 was the former "L-Terrible," now graded "A" with only 7% of riders delayed (down from 30% in 2002). In contrast, the serivce experiencing the biggest decline was the 1-California, which worsened from only 11% of riders delayed llast year to this year's 43%.
Cleanliness of Muni vehicles improved slightly from 2002, with 84% of vehicles reported clean, up from 80% in 2002. Several lines were reported 100% clean, including lines 1, 35, 45, and K; lines 14, 38, and L were reported with the worst cleanliness in the system. (Note that participants were asked if a vehicle was clean, yes or no; unlike with the crowding question, participants did not grade cleanliness of the vehicles on a 1-5 scale.
This year's survey showed a small improvement in service quality, but Muni's pace of improvement did decline since last year. The reasons for this are not measured here, but it seems that the recent budget problems faced by Muni and the city as a whole have taken a toll on service reliability, or at least on its pace of improvement. We expect that increases in funding for Muni, as well as changes in the schedule made since this survey was conducted, from this year's fare and parking fee increases will help the railway to once again make progress on on-time performance and service availability. Rescue Muni will be watching again in 2004!
route Total %
Grade Avg Norm avg % clean 2002 chg 2001 2000
resps late wait wait crowd clean grd %late 03-02 %late %late
1 21 43% F 0:05 105% 2.14 100% A 11% 31.5% 13% 24%
2 14 0% A * 0:04 35% 2.14 93% A 7% -7.3% 0%
4 23 4% A 0:03 33% 1.82 95% A 0% 4.3% 17%
5 70 16% B 0:05 55% 2.55 87% B 17% -0.8% 26% 12%
6 30 13% B 0:08 51% 3.23 93% A 9% 4.5% 4% 18%
7 23 22% C 0:06 58% 3.75 94% A 12% 9.3% 0% 38%
12 11 9% A * 0:03 33% 1.70 70% C 12% -2.4% 17%
14 26 15% B 0:09 107% 2.57 62% D 18% -2.3% 15% 32%
18 11 9% A * 0:07 42% 2.73 70% C 0% 9.1% 0% 11%
19 13 8% A * 0:05 39% 2.00 70% C 25% -17.3% 0% 42%
21 95 15% B 0:08 67% 2.46 84% B 15% -0.1% 29% 14%
22 109 12% B 0:07 93% 2.31 77% C 23% -10.9% 26% 21%
24 53 21% C 0:06 63% 2.51 72% C 15% 5.8% 14% 17%
26 14 21% C * 0:09 55% 1.83 92% A 25% -3.6% 20%
27 12 8% A * 0:05 43% 2.00 100% A 0% 8.3% 5%
28 13 0% A * 0:07 54% 3.00 100% A 14% -14.5% 0% 8%
30 42 32% D 0:07 128% 1.90 90% A 18% 13.9% 15% 50%
33 59 12% B 0:09 54% 2.30 80% B 7% 4.5% 14% 8%
35 29 3% A 0:11 53% 1.86 100% A 0% 3.4% N/A N/A
37 29 7% A 0:22 84% 1.83 70% C 0% 7.5% 0%
38 30 7% A 0:03 45% 3.15 65% D 6% 1.1% 32% 52%
43 25 22% C 0:11 69% 2.35 94% A 13% 8.4% 3% 12%
44 13 15% B * 0:10 71% 2.08 78% C 12% 3.4% 8% 10%
45 20 5% A 0:03 34% 2.63 100% A 21% -16.1% 2% 36%
47 36 6% A 0:06 67% 3.33 85% B 4% 1.7% 17% 14%
48 12 0% A * 0:05 44% 2.00 60% D 16% -16.1% 33%
49 51 0% A 0:03 30% 2.85 80% B 5% -5.3% 21% 29%
66 10 0% A * 0:01 50% 3.90 90% A 29% -28.6% 0%
71 17 6% A * 0:05 42% 3.65 94% A 11% -5.4% 10% 29%
1BX 17 6% A * 0:08 119% 3.18 76% C 0% 5.9% 0%
30X 18 6% A * 0:02 41% 3.12 100% A 11% -5.9% 21% 0%
38BX 10 10% A * 0:04 52% 3.00 100% A 13% -2.5% N/A N/A
38L 13 0% A * 0:01 27% 2.92 60% D 15% -14.9% 25% 13%
F 53 26% C 0:09 119% 2.43 86% B 13% 12.6% 9% 21%
J 91 18% B 0:09 85% 2.75 91% A 16% 1.8% 30% 25%
JKLMN 54 13% B 0:01 49% 3.08 86% B 11% 2.2% 10% 15%
K 28 0% A 0:03 27% 2.75 100% A 12% -11.7% 19% 4%
KLM 216 22% C 0:03 75% 3.00 81% B 35% -13.0% 28% 18%
L 45 7% A 0:04 46% 3.18 69% D 30% -23.3% 28% 28%
M 14 36% D * 0:07 63% 3.40 80% B 28% 7.9% 29% 25%
N 219 12% B 0:04 54% 2.70 81% B 10% 2.0% 16% 20%
Total 1741 13.8% B 0:06 65% 2.66 84% B 14% -0.2% 17% 19%
* Lines with fewer than 20 data points (in italics) will have less
reliable scores.