In April 2004, Rescue Muni conducted its annual survey of Municipal Railway service reliability. This survey is done from the rider's perspective and attempts to show the chances that an individual rider will be delayed or on an overcrowded or dirty bus or streetcar. In 2004, Muni continued along the path of improvement that began in 1999, reducing delays over 2003 substantially.
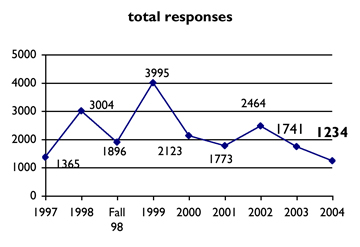
In 2004, volunteers submitted data for 1234 rides on Muni during the month of April. (1009 were taken by volunteers riding the bus; the remaining were vehicles observed going by a fixed point by volunteers.) Volunteers also recorded direction, destination, time of arrival, crowding, and cleanliness.
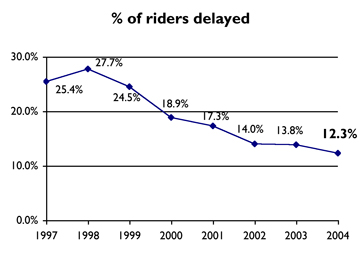
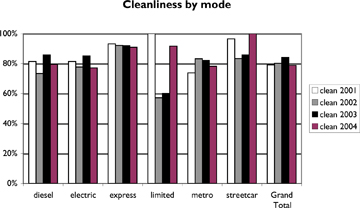
Our volunteers found that riders were delayed 12.3% of the time, a significant improvement over last year's score of 13.8% delayed, and continuing to reflect a major improvement over the worst years of 1997-99. Since the "Metro Meltdown" year of 1998, delays have been cut by well over half. As a percentage of advertised headway, waiting time also declined to 62% of posted frequency; this also reflects improved reliability. This year, service improved over 2003 for most modes (except diesel and limited-stop), but the low number of total responses may make this a less reliable figure.
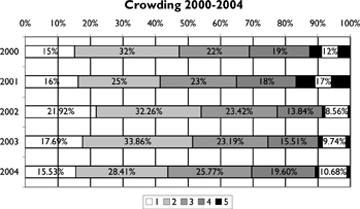
Not all metrics improved. Systemwide cleanliness worsened this year from 84% to 79% clean, with diesel, electric, and light rail vehicles all reported dirty more often. Average crowding also worsened for the second straight year,with an average crowding level of 2.8 on a scale of 1 to 5, up from 2.7 last year.
The best lines in this year's survey were the 7-Haight, JKLMN streetcar (from Embarcadero to Van Ness), 30-Stockton, 6-Parnassus, and 37-Corbett. All of these got "A" grades with fewer than 10% of riders delayed. In all, 13 lines with sufficient data (min. 15 responses) were graded "A."
Lines that performed poorly this year included the 14-Mission, graded "D" with 30% of riders delayed, and the 38L-Geary Limited, graded "C" with 25% of riders delayed. Other lines that did poorly included the F-Market historic streetcar, and K-Ingleside, both graded "C." It is notable that many fewer lines were graded poorly this year than in previous years. Most improved in 2003 was the 1-California, which was the least improved in 2003.
This year's survey showed another improvement in service reliability. Muni is to be commended for continuing to reduce delays. Problems with cleanliness and crowding are continuing to get worse, however - this is probably due to budget cuts and service reductions, but it is important that Muni management keep the focus on maintaining a quality customer experience.
It's also worth noting that there was a sharp decline in participation in this year's survey. As a result, these data are not as reliable as those from previous years. Rescue Muni needs your help in 2005 to make the survey more accurate and useful for Muni riders and service planners! Please email us at [email protected] if you'd like to participate in 2005.
| route | Total | % late | Grade | Avg wait | Norm wait | avg crowd | % clean | clean grade | 2003 % late | change 04-03 |
| 1 | 39 | 13% | B | 0:05 | 73% | 3.51 | 92% | A | 43% | -30.0% |
| 5 | 105 | 10% | A | 0:03 | 49% | 2.73 | 90% | A | 16% | -6.1% |
| 6 | 21 | 5% | A | 0:05 | 56% | 1.58 | 100% | A | 13% | -8.7% |
| 7 | 20 | 1% | A | 0:05 | 51% | 2.70 | 100% | A | 22% | -20.9% |
| 14 | 86 | 30% | D | 0:07 | 135% | 3.15 | 66% | D | 15% | 14.8% |
| 21 | 73 | 19% | B | 0:05 | 54% | 3.13 | 77% | C | 15% | 4.0% |
| 22 | 25 | 12% | B | 0:04 | 48% | 3.10 | 79% | C | 12% | 0.1% |
| 24 | 39 | 16% | B | 0:06 | 70% | 2.61 | 52% | F | 21% | -5.1% |
| 33 | 29 | 10% | B | 0:05 | 37% | 1.78 | 56% | F | 12% | -1.5% |
| 37 | 38 | 5% | A | 0:07 | 40% | 2.21 | 88% | B | 7% | -2.6% |
| 43 | 47 | 15% | B | 0:11 | 84% | 2.17 | 60% | D | 22% | -6.6% |
| 47 | 59 | 9% | A | 0:04 | 54% | 2.97 | 81% | B | 6% | 3.2% |
| 49 | 36 | 8% | A | 0:04 | 55% | 2.83 | 65% | D | 0% | 7.6% |
| F | 29 | 24% | C | 0:08 | 105% | 2.59 | 100% | A | 26% | -1.7% |
| J | 45 | 18% | B | 0:07 | 71% | 2.71 | 96% | A | 18% | -0.4% |
| JKLMN | 34 | 3% | A | 0:01 | 39% | 2.94 | 91% | A | 13% | -10.0% |
| K | 31 | 23% | C | 0:07 | 63% | 2.48 | 61% | D | 0% | 22.6% |
| KLM | 104 | 8% | A | 0:02 | 47% | 3.07 | 70% | C | 22% | -14.1% |
| L | 41 | 5% | A | 0:05 | 53% | 3.23 | 64% | D | 7% | -1.8% |
| N | 92 | 9% | A | 0:04 | 47% | 3.05 | 88% | B | 12% | -3.3% |
| 19 | 15 | 19% | B | 0:09 | 106% | 2.80 | 60% | D | 8% | 11.6% |
| 26 | 19 | 14% | B | 0:16 | 103% | 2.00 | 50% | F | 21% | -7.0% |
| 30 | 15 | 4% | A | 0:03 | 47% | 1.89 | 78% | C | 32% | -27.9% |
| 38 | 15 | 7% | A | 0:03 | 43% | 3.38 | 64% | D | 7% | 0.0% |
| 44 | 17 | 18% | B | 0:10 | 72% | 2.76 | 79% | C | 15% | 2.3% |
| 45 | 19 | 9% | A | 0:09 | 87% | 2.33 | 67% | D | 5% | 3.8% |
| 48 | 15 | 13% | B | 0:09 | 75% | 2.21 | 92% | A | 0% | 13.3% |
| 71 | 18 | 9% | A | 0:05 | 51% | 2.92 | 92% | A | 6% | 3.0% |
| 38L | 12 | 25% | C | 0:04 | 65% | 2.83 | 92% | A | 0% | 25.0% |
| Grand Total | 1234 | 12.29% | B | 0:05 | 63% | 2.81 | 79% | C | 13.8% | -1.5% |